PIRLS 2021 International Results in Reading
Performance at International Benchmarks
Trends in the Distributions of Achievement at the International Benchmarks
From PIRLS assessment cycle to assessment cycle, many countries work to improve levels of reading achievement such that increasingly higher percentages of fourth grade students reach successively higher International Benchmarks on the PIRLS achievement scale. Of course, the amount of progress and at which benchmarks this is feasible depends on the contexts for teaching and learning within each country. For example, a literacy initiative targeted to improve reading achievement for lower-performing students may be reflected in increased percentages of students reaching the Low and Intermediate Benchmarks with little change at higher benchmarks. Raising the level of reading achievement for all students across the achievement distribution is challenging and has not occurred in many PIRLS countries.
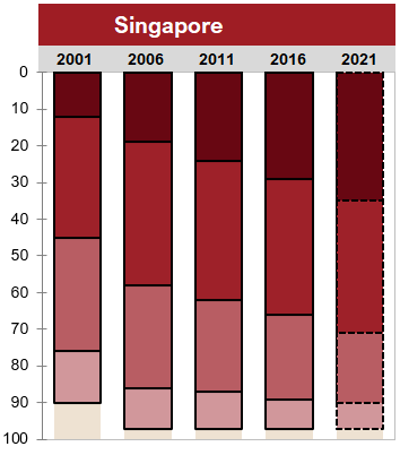
Exhibit 4.3 provides bar graphs of the trend results across the benchmarks for the 35 countries and 3 benchmarking entities that assessed students at the end of the school year and have data from previous cycles, with the countries that assessed students a year later than originally planned annotated with a bowtie (⋈) after their names. The bar graphs for each country present the distribution of achievement at the PIRLS International Benchmarks with a bar for each cycle from 2001 to 2021. The bar for 2021 has dashed lines to indicate that the 2021 results are based on data collected during the time of COVID-19 and may or may not be impacted by the pandemic. The bar graphs of the trend results are presented in alphabetical order country by country.
Example of Singapore
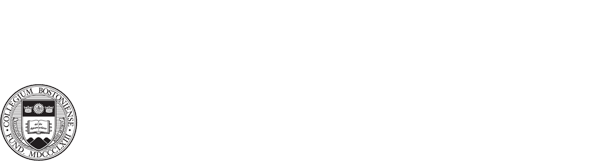
Singapore’s results provide a good example as a basis for discussion of how to read the graphs because this country has participated in all five cycles of PIRLS, had relatively high achievement in PIRLS 2001, and has increased the percentages of students reaching the higher PIRLS International Benchmarks with each successive assessment cycle.
Example of Singapore from Exhibit 4.3: Trends in the Distribution of Students Reaching the PIRLS International Benchmarks
Looking at the bars in Singapore’s graph, it can be seen that Singapore has results for all five PIRLS assessments. Each bar in the graph shows the cumulative percentage of students reaching the benchmarks in that assessment cycle. The more of the bar that is shaded (no matter how dark), the larger the percentage of students that reached the Low International Benchmark.
Looking at the bottom of Singapore’s first bar for 2001, reading down the 0 to 100 scale on the left of the graph shows that about 90 percent of the Singaporean fourth grade students reached the Low International Benchmark in the first assessment. Further, by subtraction from 100, the difference between the bottom of the bar and 100 indicates the percentage of students that did not reach the Low International Benchmark. Looking at Singapore’s 2001 bar, it can be determined that 10 percent of the students did not reach the Low International Benchmark (were “below low”) in the first PIRLS assessment.
Moving up Singapore’s 2001 bar, 76 percent of the students reached the Intermediate Benchmark. Next, 45 percent of the students reached the High International Benchmark, and 12 percent of the students reached the Advanced International Benchmark. With each higher benchmark, the shading on the bar becomes darker. Larger amounts of darker shading on a bar indicate higher percentages of students reaching the High and Advanced International Benchmarks. For the Intermediate, High, and Advanced International Benchmarks, it should be remembered that the students reaching those benchmarks demonstrated all the reading skills displayed by the students at the lower levels.
Moving to the right across the bars in Singapore’s graph across the assessment cycles, between the first two 2001 and 2006 bars, Singapore increased the percentage of students reaching each of the four International Benchmarks in PIRLS 2006 to the extent that nearly all students (97%) reached the Low International Benchmark and 86 percent reached the Intermediate International Benchmark. Also, moving across the bars for 2001 through 2021 shows steady progress in increasing the percentages of more proficient readers with each subsequent assessment cycle. That is, a successively higher percentage of students reached the High International Benchmark with each assessment and a successively higher percentage of students reached the Advanced International Benchmark.
Although Singapore was the only country to achieve such positive trend results across the International Benchmarks, several other countries have made good progress. For example, Hong Kong SAR has a similar pattern, although with smaller changes from cycle to cycle. Also, several countries were making progress across their benchmark distributions until there were declines between PIRLS 2016 and 2021, including Chinese Taipei, the Russian Federation, the Slovak Republic, and Slovenia. The decreases between 2016 and 2021 are consistent with the apparent impact of COVID-19 observed in the PIRLS trends more generally (see Exhibits 2.1.1 and 2.1.2 in Trends in Reading Achievement). However, as explained in previous sections, no control groups in 2021 are available that can tell us what the distribution would have been without the pandemic.
For most of the countries that have participated in four or five PIRLS assessment cycles, the trend results in the benchmark distributions show relative stability in the percentages of students reaching each benchmark or minor fluctuations at one or two benchmarks.
Exhibit 4.4 shows trends across the benchmarks for the 14 Northern Hemisphere countries that necessarily delayed assessing the fourth grade cohort of students until after the summer at the beginning of fifth grade. As described earlier, the students in these 14 countries were half a year older on average than the students in the other countries, which may have contributed to higher average achievement (see previous subsection: Impacts of Modifying the Assessment Schedule on Students’ Achievement). They also were 6 months older on average than the students from the same countries assessed in PIRLS 2016, which may also have contributed to increases in achievement between 2016 and 2021 (see Exhibits 2.2.1 and 2.2.2 in Trends in Reading Achievement). Once again, this lack of comparability and unavailability of control groups from the same 2021 cohort complicates interpreting the trends in achievement at the PIRLS International Benchmarks.
Although 5 of the countries with delayed assessment had increases in the percentage of students reaching the Advanced Benchmark between 2016 and 2021, considering questions about the comparability between 2016 and 2021 (COVID-19 and delayed testing), it is best to have data from 4 or 5 assessment cycles to interpret trends. Looking at the countries with data from at least 4 assessments, Georgia had increases at the Advanced and High Benchmarks, Lithuania and the United States have remained relatively stable, and Hungary and Latvia exhibited fluctuations with declines between 2016 and 2021.
For these 14 countries, it is interesting to consider trends in the percentages of students not reaching the Low Benchmark (“below low”). Several countries, including Morocco, Qatar, and the United Arab Emirates appear to have made steady progress toward more students reaching the Low Benchmark over the last 3 assessments.